1. Task Manager – CPU control
Windows Server 2016

Windows Server 2008

- On the “Details” tab in the “Task Manager”, sort the running processes in descending order according to the “CPU” column and find out which process is causing an unusual CPU usage.

1.1. The CPU is permanently busy at 100 %
- Permanent CPU usage can indicate a web application, console application, or service loop that is caused by an error in the application source code.
- Permanent CPU load by the “w3wp.exe” process can indicate a cycle of the application pool or an error in one of the web applications. According to the PID of the “w3wp.exe” process, it is necessary to find the relevant application pool in IIS and identify the web applications that are served by this application pool.
- Permanent CPU usage by the “firebird.exe” process can indicate either poorly designed SQL queries that disproportionately use the Firebird database server, or a long-term increasing database server load that must be addressed by a hardware increase in the number of processor cores.
- Permanent CPU usage by the “sqlserver.exe” process can indicate either poorly designed SQL queries that disproportionately load the MSSQL database server, or a long-term increasing database server load that must be addressed by a hardware increase in the number of CPU cores.
1.2. CPU usage oscillates around limit 70 % and above
- Higher CPU utilization by the “w3wp.exe” process may indicate suboptimal algorithms in some of the web applications. According to the PID of the “w3wp.exe” process, it is necessary to find the relevant application pool in IIS and identify the web applications that are served by this application pool.
- Higher CPU usage by the “firebird.exe” process can indicate either poorly designed SQL queries that disproportionately load the Firebird database server, or a long-term increasing database server load that must be addressed by a hardware increase in the number of CPU cores.
- Higher CPU usage by the “sqlserver.exe” process can indicate either poorly designed SQL queries that disproportionately use the MSSQL database server, or a long-term increasing database server load that must be addressed by a hardware increase in the number of CPU cores.
1.2.1. Examples of suboptimal algorithms
- For cycles that call an SQL query in each iteration – the solution is to load all data in bulk before the for cycle itself, and then index this data into a “Dictionary” object. This procedure is described in detail in the separate External function manual.
- Generating large files in PDF or XLSX format using “Aspose” libraries – the solution is a hardware increase in the number of cores.
- High-resolution image processing – the solution is a hardware increase in the number of cores.
- Non-optimal algorithms are often located in one of the external functions, or they can be caused by printing to printing templates. In both cases, it is important to check the script report (total_worker_time) and the external functions (total_worker_time), in which the long durations of the scripts or external functions are displayed at the top of the report.
1.3. CPU usage oscillates below 50 %
This condition is normal.
2. Task Manager – memory check
Windows Server 2016

Windows Server 2008

- On the “Details” tab in the “Task Manager”, sort the running processes in descending order according to the “Memory (private working set)” column and find out which process is causing unusual memory usage.

2.1. The memory is permanently used at 100 %
- Permanent memory usage by the “w3wp.exe” process may indicate suboptimal algorithms or loading too much data from the database in one of the web applications. According to the PID of the “w3wp.exe” process, it is necessary to find the relevant application pool in IIS and identify the web applications that are served by this application pool. For all these applications, it is necessary to turn on database logging and memory consumption measurement in the NET Genia settings, see chapter “NET Genium logging and log evaluation”.
- Permanent memory usage by the “w3wp.exe” process may indicate suboptimal algorithms in some of the web applications.
- Permanent memory usage by the “firebird.exe” process can indicate either poorly designed SQL queries that disproportionately load the Firebird database server, or a long-term increasing database server load that must be addressed by a hardware increase in memory.
- Permanent memory usage by the “sqlserver.exe” process can indicate either poorly designed SQL queries that disproportionately load the MSSQL database server, or a long-term increasing database server load that must be addressed by hardware-increasing memory.
- The permanent memory usage of the “sqlserver.exe” process means, among other things, that one of the instances (usually the default one) does not have a set memory usage limit, which in turn prevents the operating system and other applications from running properly. Each instance of MSSQL should always have a memory usage limit set to a safe limit, such as only 80 % from the total memory so that the operating system and other applications have enough space for their operation.
2.2. Memory usage is between 60 % a 99 %
- High memory usage by the “w3wp.exe” process may indicate that some of the web applications are loading too much data from the database. According to the PID of the “w3wp.exe” process, it is necessary to find the relevant application pool in IIS and identify the web applications that are served by this application pool. For all these applications, it is necessary to turn on database logging and memory consumption measurement in the NET Genia settings, see chapter “NET Genium logging and log evaluation”.
- It is a good idea to consider a hardware increase in memory primarily to run more memory-intensive tasks once.
- You must check the MSSQL server instance settings to see if it has a memory usage limit.
2.3. Memory usage is below 50 %
This condition is normal.
3. Pending Windows operating system updates
- On the application and database server, check the queue for pending updates that need to complete the installation. These updates can wait in the background and take up memory for the entire server, even though in Task Manager it appears that the server has enough free memory. Consequently, it does not have the resources to start and run processes normally, and both common applications on the application server and the database server collapse. Typically, this condition on the database server is that the MSSQL instance allocates only 200MB, for example, even though it has a much higher limit or no limit on the allocated memory at all.
4. Debug Diagnostic Tool
- In critical situations, it is necessary to end individual processes in the “Task Manager”. Before this step, it is useful to create a “memory dump” of the process, which can then be analyzed using the “Debug Diagnostic Tool” and can detect both looping algorithms and the reason for memory congestion.
- A simplified procedure for working with “memory dumps” is given in the file “Config\Tools\MemoryDumps.txt” every NET Genium:
1) Download and install Debug Diagnostic Tool v2 Update 2 (https://www.netgenium.com/download/DebugDiagx64.msi)
2) Locate memory dumps (C:\Users\abc\AppData\CrashDumps)
3) Run DebugDiag
4) Default Analysis / CrashHangAnalysis
5) Add Data Files
6) Start Analysis
5. My computer – Disk Check
- Incoming disk space often means irreversible data loss due to database consistency. The fastest way to free up disk space is to delete log files or database and file backups.

- The “TDP x-Ray” program is an ideal tool for detailed analysis of disk occupancy by individual directories and files.

- The log files include both the IIS log files located in the default directory “C:\inetpub.\logs\LogFiles ” , so the log files of specific NET Genium – the “Logs” directory of each NET Genium.
- Database backups are often located in the “Backup” directory of each NET Genium, or in the “E:\BackupServer”.
- By default, IIS has web application traffic logging turned on, which must be turned off as soon as possible. At the same time, it is important to delete existing logs, which are stored in the “C:\inetpub\logs\LogFiles”. Use the following procedure to determine the exact location of these logs from the specific IIS settings.
- Go to the IIS settings and select the highest node of your server/computer (for example “OFFICE” / “TOMAS-PC”) so that the settings are overwritten to other child nodes, and select “Logging” / “Logging” in the “IIS” section.

- Then click “Disable” in the “Actions” panel on the right side of the window. This disables vehicle logging for your server/computer node.

6. Performance Manager – control of disk operations
- On the “Performance” tab in the “Task Manager”, click on the “Open Resource Monitor” link.

- On the “Disk” tab in the “Resource Monitor”, sort the disk activities in descending order according to the “Write” column and find out which files – Firebird or MSSQL databases – show unusual disk writes.

7. RunningQueries.exe
- The “RunningQueries.exe” application is located in the “bin” directory of each NET Genium, and is used to evaluate currently processed database queries. Running this application creates a “RunningQueries.htm” log file in the “Logs” directory, and opens this log file at the same time. The queries mentioned in this log file may reduce the performance of the database server. At the same time, they can be used to identify the database in which performance issues occur.

8. SQL Server – Activity Monitor
- Start “SQL Server Management Studio” and click on the “Activity Monitor” icon.

- On the “Recent Expensive Queries” tab, identify the list of recently run demanding database queries. These queries can also be used to identify the database in which performance issues occur.

9. SQL Server – Top Queries by Total CPU Time
- Start “SQL Server Management Studio”, right-click on the top node in “Object Explorer”, and select “Reports / Standard Reports / Performance – Top Queries by Total CPU Time”.

- In this report, identify the list of database queries that are most burdensome on the database server. These queries can also be used to identify the database in which performance issues occur.

- Once the database in which the performance issues occur is identified, it is more convenient to run a specific NET Genium and display the “dm_exec_query_stats (total_worker_time)” report. This report displays an identical list of database queries that are most burdensome on the database server, and also offers the ability to identify the control that runs the database query (“…” link).
- SQL Server also offers a “Top Queries by Average CPU Time” report, which has the equivalent in NET Genium under the “dm_exec_query_stats (average_worker_time)” report.
- In general, it is recommended to browse the reports in the following order:
- dm_exec_query_stats (total_worker_time) – In this report, both database queries that may have a reasonable query processing time but run too often and database queries that run at reasonable intervals but have a long processing time come first.
- dm_exec_query_stats (execution_count) – In this report, database queries that run frequently come first, so it is important to consider “average_worker_time” for these queries.
- dm_exec_query_stats (average_worker_time) – In this report, database queries come first, which have a long processing time of individual queries.
- A typical incorrectly designed query error that runs very often and does not have an index set on the “ng_url” column.

10. NET Genium logging and log evaluation
- The steps in the previous chapters should be used to identify the database in which the performance issues occur.
- Enable logging in the NET Genium settings by selecting “To database”. If you are dealing with increased memory usage, also turn on “Measure memory consumption”. A detailed description of NET Genia settings is given in a separate “NET Genium settings” manual.

- Evaluate logs with reports, and identify view pages, edit forms, database queries, scripts, or external functions that last the longest. A detailed description of the reports is given in a separate manual Reports.
- View pages (average_worker_time)
- View pages (total_worker_time)
- Edit forms (average_worker_time)
- Edit forms (total_worker_time)
- Database queries (average_worker_time)
- Database queries (total_worker_time)
- Scripts (average_worker_time)
- Scripts (total_worker_time)
- External functions (average_worker_time)
- External functions (total_worker_time)
11. Editing SQL queries and program code
- The most common cause of performance issues are improperly designed database queries or inefficient retrieval of data from the database. In most cases, you just need to set the indexes on the columns in the database correctly, or change the way the database tables are joined. It is far more laborious, but just as important, to change the way data is retrieved from the database so that as few queries as possible are sent to the database, and always run all queries of a given task with only one connection to the database.
11.1. Indexes
- Indexes are used to speed up database queries, most often to speed up SELECT commands.
Where to set the index
- Enabling/disabling indexes for the “pid” and “pform” columns is performed on the “Administration” tab in the properties of the edit form.
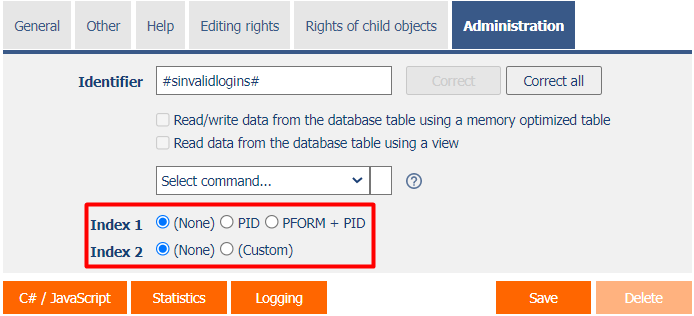
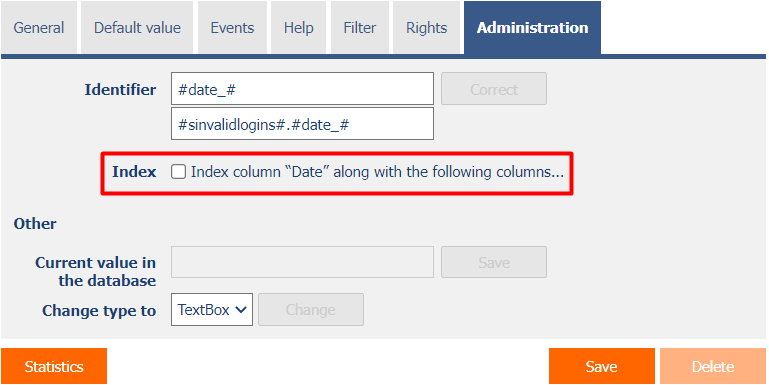
- Enabling/disabling indexes for all other database columns is performed on the "Administration" tab in the properties of the database control.
When and why to set an index
- When dealing with database performance optimization, it is important to follow the basic rule that every column that occurs in the join conditions on either the left or right side of the condition must be indexed. All other joins can be turned on/off only after some time of the application, when the database is gradually filled with data. Over time, the need to set up indexes changes, primarily according to the growing number of records in each database table, and consequently according to the way this data is read.
- The (ID) column, which is the primary key of the database table, is often used on the left side of the join condition. This column is indexed automatically.
- A foreign key – the ForeignKey control – is often used on the right side of the join condition. The index on this column is automatically turned on when the control is created, but it is possible to turn it off later.
- Gradual indexing on/off must be based on the basic nature of indexes – indexing a given column only makes sense if the value of the column is evaluated using the operator “equals”, “is defined” or “is not defined”.
- NET Genium logging to the database must be turned on before starting any index tuning.
Reports
- NET Genium includes reports with an analysis of all indexes in the database, along with a recommendation on where to turn on the index. In the case of the MSSQL database, it also contains reports with index fragmentation and index usage statistics. These reports are described in detail in the separate manual “Reports”, chapter “Indexes”.
- In the “Joins” report, it is important to look for the occurrence of three “!!!” exclamation marks. Exclamation points indicate columns used in join conditions that do not have an index enabled. For these columns, it is important to turn on the index immediately.
- All other entries in the “Joins” report are only informative and point to columns used in database query conditions for which the index may need to be turned on in the future.
- The “Joins” report does not take into account queries that are used inside the source codes of external functions or console applications. Therefore, it only contains queries designed in the database query designer.
How indexes work
- Understanding the principle of indexes is key to properly designing indexes in a database. The following example in the language C# demonstrates searching for records in a database using a slow sequential traversal, followed by a fast dictionary search.
- Sequential crawling is analogous to a situation where the database server does not have an index available and is therefore forced to crawl through all of the database records – one at a time – and try to find a match based on the search criteria.
- Using a dictionary is analogous to a database server having an index on a given column and looking for all records that have one particular value stored in that column. For all other search criteria – other than matching a single specific value – you must use sequential traversal, and therefore cannot use an index.
using System.Data;
using System.Diagnostics;

// SELECT * FROM ng_table WHERE ng_tb IN ('10', '100', '1000', '10000', abc')
string[] search = new string[] { "10", "100", "1000", "10000", "abc" };

DataTable data = new DataTable();
data.Columns.Add("ng_tb");

for (int i = 0; i < 5000000; i++)
{
  data.Rows.Add(i.ToString());
}

Stopwatch sw1 = Stopwatch.StartNew();
foreach (string s in search) Console.WriteLine(s + ": " + Find(data, s));
Console.WriteLine("Sequential browsing: " + sw1.Elapsed);
Console.WriteLine();

Dictionary<string, DataRow> dictionary = new Dictionary<string, DataRow>();
foreach (DataRow row in data.Rows)
{
  dictionary.Add(row["ng_tb"].ToString(), row);
}

Stopwatch sw2 = Stopwatch.StartNew();
foreach (string s in search) Console.WriteLine(s + ": " + Find(dictionary, s));
Console.WriteLine("Dictionary: " + sw2.Elapsed);
Console.WriteLine();

Console.ReadLine();


private static bool Find(DataTable data, string search)
{
  foreach (DataRow row in data.Rows) if (row["ng_tb"].ToString() == search) return true;
  return false;
}

private static bool Find(Dictionary<string, DataRow> dictionary, string search)
{
  if (dictionary.ContainsKey(search)) true;
  return false;
}
11.2. Joins
LEFT JOIN
- SELECT * FROM ng_invoice LEFT JOIN ng_item ON ng_item.pid = ng_invoice.id
- Load all invoices along with all items
- In the resulting table, invoices are duplicated as many times as each invoice has items
- In the resulting table there are also invoices that have no item (all columns from the joined item table have a NULL database value stored in the resulting table)
- SELECT * FROM ng_invoice LEFT JOIN ng_item ON ng_item.pid = ng_invoice.id WHERE ng_item.id IS NULL
- Retrieve all invoices that have no item
- In the resulting table, there are only invoices that have no item (all columns from the joined item table have a NULL database value stored in the resulting table)
- SELECT * FROM ng_invoice LEFT JOIN ng_item ON ng_item.pid = ng_invoice.id WHERE ng_item.ng_price > 100
- Retrieve all invoices that have an item with a price greater than 100
- In the resulting table, invoices are duplicated as many times as each invoice has items with a price greater than 100
- This query is a classic example of “LEFT JOIN + Condition” where it is beneficial to change the slower LEFT JOIN to the faster INNER JOIN.
INNER JOIN
- SELECT * FROM ng_invoice INNER JOIN ng_item ON ng_item.pid = ng_invoice.id
- Retrieve all invoices that have at least one item
- In the resulting table, invoices are duplicated as many times as each invoice has items
- In the resulting table are only invoices that have at least no item
11.3. The most common errors in database queries
- SELECT * – the query should never contain an asterisk as a wildcard for all columns of the source database table, as well as all columns of all accepted tables, but should always contain a comma-separated list of read columns.
- Loading strings of unlimited length (TextArea, RichTextBox, MultiListBox) causes a significant slowdown in database query processing, especially on the Firebird database server. These columns should only be loaded when absolutely necessary.
- Detailed description of how to retrieve data from the database using C# including examples is given in the separate manual External functions, chapter “Reading data from the database”.
11.4. The most common errors when joining
- Failure to follow the basic rule that every column that occurs in join conditions on either the left or right side of the condition must be indexed.
- Joins defined in the database query designer are often either completely useless because the result does not use columns retrieved from the accepted database table, uses a slower “LEFT” instead of a faster “INNER” in cases where “LEFT” is unnecessary, or uses “LEFT” in conjunction with the database condition. query, see the Reports manual, chapter “Database Queries (LEFT JOIN + Condition)”.
- The moment large database tables join together, or join them too much, you need to completely change the data retrieval logic, and split a costly database query with many joins into more simple database queries.
11.5. SQL Server Database Engine Tuning Advisor – SQL query debugging
- SQL Server includes a useful tool for debugging database queries – SQL Server Database Engine Tuning Advisor. A simplified procedure for debugging database queries is provided in the “Config\Tools\TunningQueries.txt” every NET Genium:
1) Run SQL Server Management Studio
2) Right click on the instance name and select 'Reports / Standard Reports / Performance - Top Queries by Total CPU Time'
3) Identify top queries with constants in a condition that can be improved with indexes
4) Right click on the background of the report and select 'Print / Excel'
5) Open printed Excel file
6) Create 'netgenium.sql' file and insert top queries using the following syntax:

use netgenium
go
SELECT ...
SELECT ...

7) Run SQL Server Database Engine Tuning Advisor
8) Click 'Start New Session'
9) Select 'File' as a 'Workload' and browse for 'netgenium.sql'
10) Mark 'netgenium' database
11) Click 'Start Analysis'
12) Analyze 'Recommendations' tab
13) Create new indexes as recommended