Manual in PDF format
1. Reports


- Reports are available for users with administrator privileges.
Printing
- Button for printing the currently displayed report from a web browser.
- The report can also be called up using the “CTRL + P” key.
Report
- Button to open the currently displayed report on a new web browser tab.
1.1. Database table
- This report shows the contents of the selected database table from the drop-down list, compiled using the SQL query “SELECT * FROM ng_ ORDER BY id”.
- The drop-down list contains a list of all database tables in the database.
- The table title also serves as a link to open the associated edit form on a new web browser tab.

1.2. Edit form
- This report shows the details of the selected edit form from the drop-down list.
- The report consists of the metadata of the edit form stored in the “stables” table, as well as a list of all its controls read from the “scolumns” table.
- The drop-down list contains a list of all edit forms in the application.
- The table title also serves as a link to open the edit form on a new web browser tab.
- In the edit form metadata table, a pencil icon appears in the first and last columns to change or delete the edit form settings.
- In the table listing the controls, a pencil icon appears in the first and last columns to change or delete the control's settings.

1.3. View page
- This report shows the details of the selected view page from the drop-down list.
- The report consists of the view page metadata stored in the “sviewpages” table, as well as a list of all its controls retrieved from the “sviewfields” table.
- The drop-down list contains a list of all view pages in the application.
- The table title also serves as a link to open the view page on a new web browser tab.
- In the preview page metadata table, a pencil icon appears in the first and last columns to change or delete the preview page settings.
- In the table listing the controls, a pencil icon appears in the first and last columns to change or delete the control's settings.

1.4. Button
- This report shows the details of the selected button from the drop-down list.
- The report consists of button metadata stored in the “sviewfields” table.
- The drop-down list lists all the buttons located on the view pages across the entire application.
- The table title also serves as a link to open the view page on the new web browser tab in which the button is located.
- In the button metadata table, a pencil icon appears in the first and last columns to change or delete control settings.

1.5. Other
1.5.1. Database tables (COUNT (*))
- This report displays a list of all database tables and views in the database, along with the number of records stored in each database table or view.
- The report is sorted by the number of records in descending order.
- Database tables, which are used to store user settings for controls or statistics, contain a larger icon for deleting all data in the database table.
- Database tables, which are used to store the history of records (_history), contain a smaller icon designed to delete data older than 6 months in the database table.

1.5.2. Database tables (MAX (ID))
- This report displays a list of all database tables in the database, along with the maximum value of the primary key. In the case of the “Firebird” database server, the report also shows the value of the generator associated with the database table, which should have the same value as the current maximum value of the primary key for a consistent database.
- The report is sorted by the maximum value of the primary key in descending order.

1.5.3. Database tables (SELECT *)
- This report displays a list of SQL queries in the form “SELECT * FROM ng_”, compiled from database tables associated with all edit forms across the entire application.
- SQL queries are displayed in groups according to the applications in which the associated edit forms are located. Above each group, the name of the application group and the application to which the SQL queries belong is displayed in the comment.

1.5.4. Database tables (Locks)
- This report shows a list of all active locks with the possibility of their immediate release.
- The report consists of the locks of the edit forms stored in the “stables_lock” table, as well as the locks of the currently running scripts stored in the “sngscript_processing” table.
- Edit form locks are used to calculate the value of “TextBox” controls with an integer data type and the “Max+1” function enabled, as well as for data synchronization.
- Script locks are used for the “PROTECTSCRIPT()” server function.

- The lock must be released manually when it is evident that an anomaly has occurred on the application or database server and the lock has not been released correctly, which is provided by NET Genium itself by default. Users cannot then save pending records in edit forms that contain “MAX+1 textboxes” and receive the following message:

- An incorrect database lock release can occur in the following situations, and this release must be performed manually:
- Both the application and the database server may be running low on system resources. A detailed description of this issue is provided in a separate Troubleshooting performance issues guide.
- The network connection between the application and database server may break, which may be indicated, among other things, by the following message in the “Errors.log” file: “This SqlTransaction has completed; it is no longer usable. “
1.5.5. Indexes
- This report shows an analysis of the indexes of the database tables associated with all edit forms in the application.
- Each report record also serves as a link to open the settings of that edit form or control.
- When dealing with database performance optimization, it is important to follow the basic rule that every column that occurs in the join conditions on either the left or right side of the condition must be indexed. All other joins can be turned on/off only after some time of the application, when the database is gradually filled with data. Over time, the need to set up indexes changes, primarily according to the growing number of records in each database table, and consequently according to the way this data is read.
- Gradual indexing on/off must be based on the basic nature of indexes – indexing a given column only makes sense if the value of the column is evaluated using the operator “equals”, “is defined” or “is not defined”.


- Enabling/disabling indexes in the properties of the edit form is performed on the “Administration” tab.

- Enabling/disabling indexes in the control properties is performed on the “Administration” tab.

- Examples:
- If the index is not set on the column on which it should be set from the essence of the join, three exclamation points are given for the control, along with the abbreviation “JC” (QueryBuilder Join Condition) and the frequency of use of the control in the join conditions. The frequency with which the control is used plays a role in deciding whether to turn on the index. If the column is used in joint conditions only once or generally in a minimal amount,
- the index may be unnecessary due to the number of records in the referenced table, it will only take up space in the database, and data loading speed will not help,
- or it may be an error, and the column is incorrect in the join conditions.

- If an index is set on the column, the word “INDEX” is displayed for that control.
- In the image below, the column is not used in any join or condition.
- Indexes in database tables from the “Settings” application have their justification, because index analysis takes into account only the application logic resulting from the settings of individual applications, but does not take into account SQL queries that run in the background using internal algorithms NET Genium.
- Likewise, SQL queries that run third-party tools on the database are not taken into account.

- If the control shows the word “INDEX” and there is another column or columns from the same table next to the comma, it is a federated index, and that column is indexed at the same time as another column or with several other columns.

- If the control is abbreviated as “JC” (QueryBuilder Join Condition), the column is used in join conditions. The colon is followed by the frequency of use of the column in these joints.

- If the control is abbreviated as “C” (QueryBuilder Condition), the column is used in database query conditions with the “equals”, “defined”, or “not defined” operator. The colon indicates the frequency of use of the column in these conditions.

- If the control is abbreviated as “AC” (AutoSum Condition) in square brackets, the column is used in “AutoSum” control conditions to evaluate the number, sum, maximum or minimum value, or average. After the colon is the frequency of use of the column in these autosums.
- If the control is abbreviated “F” (Filter) in square brackets, the given column is used as a filter for view tables, calendars, graphs, etc.
1.5.6. Indexes (dm_db_index_physical_stats)
- For database server “MS SQL Server”
- This report shows a list of index fragmentation of edit forms or database controls.
- Each report record also serves as a link to open the settings of that edit form or control.
- The program “SqlBackup.exe/rebuidindexes” or “SqlBackup.exe/reorganizeindexes” is used to defragment the indexes. A detailed description of the “SqlBackup.exe” program is given in the separate Utilities manual.

1.5.7. Indexes (dm_db_index_usage_stats)
- For database server “MS SQL Server”
- This report shows a list of index usage by the database server.
- user_seeks – global index search frequency using the “SEEK” operation
- user_scans – global frequency of index searches using the “SCAN” operation
- user_lookups – global index search frequency using the “LOOKUP” operation
- user_updates – global index update frequency
- Each report record also serves as a link to open the settings of that edit form or control.
- Indexes that have zero in the “user_seeks”, “user_scans”, and “user_lookups” columns should be optimized or deleted completely because “SQL Server” does not use them to speed up database queries and only updates them (if the value is “user_updates”). “Greater than zero).

1.5.8. Indexes (dm_db_index_usage_stats)
- For database server “MS SQL Server”
- This report displays a list of unused indexes by the database server.
- user_seeks – global index search frequency using the “SEEK” operation
- user_scans – global frequency of index searches using the “SCAN” operation
- user_lookups – global index search frequency using the “LOOKUP” operation
- user_updates – global index update frequency
- Each report record also serves as a link to open the settings of that edit form or control.
- Indexes that have zero in the “user_seeks”, “user_scans”, and “user_lookups” columns should be optimized or deleted completely because “SQL Server” does not use them to speed up database queries and only updates them (if the value is “user_updates”). “Greater than zero).

1.5.9. Full-text languages
- For database server “MS SQL Server”
- This report shows a list of all full-text languages.

1.5.10. Full-text catalogues
- For database server “MS SQL Server”
- This report shows a list of all full-text catalogues.

1.5.11. Full-text indexes
- For database server “MS SQL Server”
- This report displays a list of all full-text indexes.

1.5.12. Full-text columns
- For database server “MS SQL Server”
- This report lists all full-text columns.

1.5.13. Database queries
- This report lists all database queries across the entire application created in the database query designer.
- The database query table displays information about the control to which the database query is associated, and the first column displays a pencil icon to change the settings of the associated control.
- The name of the view page or edit form also serves as a link to open the view page or edit form on a new tab in the web browser.

1.5.14. Database queries (Templates)
- This report displays a list of all database queries that are marked as templates – they have the template name filled in the database query settings on the “Other” tab.

- The database query table displays information about the control to which the database query is associated, and the first column displays a pencil icon to change the settings of the associated control.
- The name of the view page or edit form also serves as a link to open the view page or edit form on a new tab in the web browser.

- When creating a new database query, all available templates are available in the “Templates” drop-down list on the “General” tab. After selecting a template, all parameters of the database query will be automatically pre-filled with data from the selected template.

1.5.15. Database queries (Unused Joins)
- This report lists all database queries that join database tables, but then do not use those tables for anything:
- the columns of these tables do not appear in the conditions, aggregation columns, or database query headers
- the columns of these tables do not appear in the columns of the lookup table or in the details.

1.5.16. Database queries (LEFT JOIN + Condition)
- This report displays a list of all database queries that join database tables using LEFT JOIN, and at the same time contain a condition for the value of one of the columns of the accepted table using the set of operators “equals”, “does not equal”, etc. The only operator that is excluded from this set is the “undefined” operator. This operator is important in the case of LEFT JOIN because it filters all records for which the JOIN operation could not be satisfied under the specified conditions.
- It is advisable to check the database queries that appear in this report and, if necessary, replace them with INNER JOIN in order to optimize the loading speed of the database query. INNER JOIN processing is always faster than LEFT JOIN.

1.5.17. Database queries (total_worker_time)
1.5.18. Database queries (total_rows)
1.5.19. Database queries (execution_count)
1.5.20. Database queries (average_worker_time)
1.5.21. Database queries (average_rows)
1.5.22. Database queries (max_worker_time)
- This report shows database query call statistics created in the database query designer, sorted in descending order
- total_worker_time – total query processing time by the database server,
- total_rows – the total number of records returned by the query,
- execution_count – number of query executions,
- average_worker_time – average query processing time by the database server,
- average_rows – the average number of records returned by the query,
- max_worker_time – maximum query processing time by the database server.
- This report is available only if database logging is enabled in the NET Genium settings and there is at least one database query call record. A detailed description of NET Genium settings is given in the separate NET Genium settings manual.
- The database query table displays information about the control to which the database query is associated, and the first column displays a pencil icon to change the settings of the associated control.
- The name of the view page or edit form also serves as a link to open the view page or edit form on a new tab in the web browser.

- Using the “…” link in the “Logging” column, it is possible to display a detailed report on the new web browser tab with individual records of database query calls and data on
- the date and time the query was started,
- the user who initiated the query
- query processing time in milliseconds,
- the number of records returned, and
- specific SQL query.

- The number of records is limited to 100 by default. This number can be manually increased or decreased by changing the “maxrows” parameter in the report URL.

1.5.23. dm_exec_query_stats (total_worker_time)
1.5.24. dm_exec_query_stats (execution_count)
1.5.25. dm_exec_query_stats (average_worker_time)
1.5.26. dm_exec_query_stats (max_worker_time)
- For database server “MS SQL Server”
- This report shows call statistics for the longest-running database queries, sorted in descending order
- total_worker_time – total query processing time by the database server,
- execution_count – number of query executions,
- average_worker_time – average query processing time by the database server,
- max_worker_time – maximum query processing time by the database server.

1.5.27. Scripts (total_worker_time)
1.5.28. Scripts (execution_count)
1.5.29. Scripts (average_worker_time)
1.5.30. Scripts (max_worker_time)
- This report shows the execution statistics of server-side scripts created in the script designer, sorted in descending order
- total_worker_time – total script processing time,
- execution_count – number of script executions,
- average_worker_time – average script processing time,
- max_worker_time – maximum script processing time.
- This report is only available if database logging is enabled in the NET Genium settings and there is at least one script execution record. A detailed description of NET Genium settings is given in the separate NET Genium settings manual.
- The script table displays information about the edit form or control that the script is associated with, and the first column displays a pencil icon to change the definition of the script.
- The name of the view page or edit form also serves as a link to open the view page or edit form on a new tab in the web browser.

- Using the “…” link in the “Logging” column, it is possible to display a detailed report with individual script execution records and data on the new web browser tab.
- date and time of script execution,
- the user who ran the script and
- script processing time in milliseconds.

- The number of records is limited to 100 by default. This number can be manually increased or decreased by changing the “maxrows” parameter in the report URL.

1.5.31. View pages (Export)
- This report compiles a word document in which all view pages are listed, including their application groups, applications and categories, together with the help of the given view page.

1.5.32. View pages (total_worker_time)
1.5.33. View pages without postbacks (total_worker_time)
1.5.34. View pages (execution_count)
1.5.35. Landing pages without postbacks (execution_count)
1.5.36. View pages (average_worker_time)
1.5.37. Non-posting pages (average_worker_time)
1.5.38. View pages (max_worker_time)
1.5.39. Non-posting pages (max_worker_time)
- This report shows pageview statistics, sorted in descending order
- total_worker_time – total processing time of the view page,
- execution_count – number of views of the view page,
- average_worker_time – average processing time of the view page,
- max_worker_time – maximum processing time of the view page.
- This report is only available if logging to the database is enabled in the NET Genium settings and there is at least one view page view record. A detailed description of NET Genium settings is given in the separate NET Genium settings manual.
- In the preview page table, a pencil icon appears in the first column to change the settings for this preview page.
- The name of the view page also serves as a link to open the given view page in a new tab of the web browser.

- Using the “…” link in the “Logging” column, it is possible to display a detailed report on individual web browser tabs with individual records of view page views and data on
- the date and time the view page was displayed,
- the user who viewed the view page
- view page processing time in milliseconds; and
- information on whether this is the first load of the view page or its update (postback).

- By default, the minimum view page processing time is set to 0 milliseconds, so all view page display records are displayed, including those that took 0 milliseconds to process. This minimum time can be increased or decreased by changing the “mintime” parameter in the report URL.
- The number of records is limited to 100 by default. This number can be manually increased or decreased by changing the “maxrows” parameter in the report URL.

1.5.40. Edit forms (Export)
- This report compiles a word document in which all edit forms, including their application groups, applications and categories, are listed, together with the help of the given edit form, and
- with all its database controls,
- with RichText controls labeled “Report Help”, and
- with other controls that have completed help.
- Each control in the report contains the following data:
- control name,
- control type,
- control identifier,
- control data type,
- control help, if filled in and
- control note, if filled.

1.5.41. Edit forms (total_worker_time)
1.5.42. Edit forms without postbacks (total_worker_time)
1.5.43. Edit forms (execution_count)
1.5.44. Edit forms without postbacks (execution_count)
1.5.45. Edit forms (average_worker_time)
1.5.46. Edit forms without postbacks (average_worker_time)
1.5.47. Edit forms (max_worker_time)
1.5.48. Edit forms without postbacks (max_worker_time)
- This report shows the display statistics of the edit forms, sorted in descending order
- total_worker_time – total processing time of the edit form,
- execution_count – number of edit form views,
- average_worker_time – average processing time of the edit form,
- max_worker_time – maximum processing time of the edit form.
- This report is only available if database logging is enabled in the NET Genium settings and there is at least one edit form view record. A detailed description of NET Genium settings is given in the separate NET Genium settings manual.
- In the table with edit forms, a pencil icon is displayed in the first column, which is used to change the settings of this edit form.
- The name of the edit form also serves as a link to open the given edit form on a new tab of the web browser.

- Using the “…” link in the “Logging” column, it is possible to display a detailed report on the new web browser tab with individual records of the display of edit forms and data on
- the date and time the display of the edit form,
- the user who viewed the edit form,
- edit form processing time in milliseconds; and
- information on whether this is the first loading of the edit form or its updating (postback).

- The minimum display time for processing the edit form is set to 0 milliseconds by default, so all display records of edit forms are displayed, including those whose processing took 0 milliseconds. This minimum time can be increased or decreased by changing the “mintime” parameter in the report URL.
- The number of records is limited to 100 by default. This number can be manually increased or decreased by changing the “maxrows” parameter in the report URL.

1.5.49. Controls (Templates)
- This report shows a list of all controls that are marked as templates – they have the template name filled in the control settings on the “Administration” tab.

- In the control table, a pencil icon appears in the first column to change control settings.
- The name of the view page or edit form also serves as a link to open the view page or edit form on a new tab in the web browser.

- Templates support the following controls:
- DataGrid
- LiteDataGrid
- Picker
- When creating a new control, all available templates are available in the “Templates” drop-down list on the “General” tab. After selecting a template, all parameters of the control will be automatically pre-filled with data from the selected template.
- If we are creating a control on a view page, only control templates from view pages that have the same source table set in the database query (“SELECT * FROM ng_sourcetable”) are available.
- If we create a control in an edit form, only control templates from edit forms that have the same source table set in the database query (“SELECT * FROM ng_sourcetable”) are available.
1.5.50. Controls (JavaScript + Insufficient Rights)
- This report shows a list of all controls that are accessed using javascript, but the control itself has different rights settings than javascript.
- This discrepancy may be in the edit form end with an exception because the target user does not have to have permission on the control itself, but has the right to javascript. Javascript then refers to a control that is not rendered in the edit form.
- In the control table, a pencil icon appears in the first column to change control settings.
- The name of the view page or edit form also serves as a link to open the view page or edit form on a new tab in the web browser.

1.5.51. Controls (Read-only + Event)
- This report lists all controls that are set to “Read Only” and also contain one of the “OnBlur”, “OnChange”, “OnClick” or “OnFocus” javascript events. Modern web browsers do not trigger these javascript events for these controls.
- This mismatch can cause inconsistencies in the edit form data, because controls that are set to “Read Only” can be assigned a value using, for example, a pickup or javascript. The picker automatically fires an “OnChange” event on the control, but the “OnChange” event does not fire.
- In the control table, a pencil icon appears in the first column to change control settings.
- The name of the view page or edit form also serves as a link to open the view page or edit form on a new tab in the web browser.

1.5.52. Controls (Data type mismatch)
- This report lists all database controls for which NET Genium registers a different data type than the column associated with that control in the database actually has.
- This mismatch can be caused by changing the data type of the column directly in the database, for example using “Microsoft SQL Server Management Studio”.

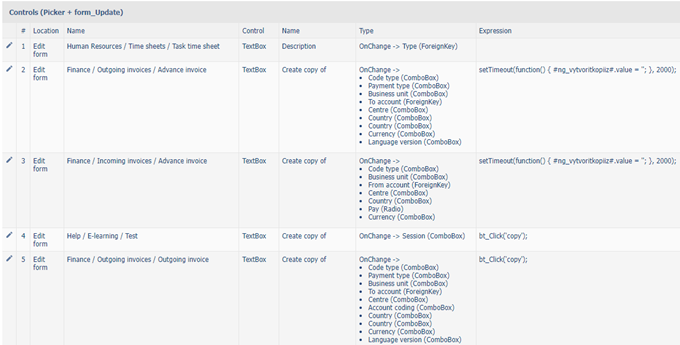
1.5.53. Controls (Picker + form_Update)
- This report displays a list of all database controls that are part of one of the pickers and for which it may be necessary to include a call to the javascript function “form_DisableUpdate” in the “onchange” event.
- These are the following controls for which NET Genium automatically updates the form after changing their value with the picker:
- Inserting a value into a ComboBox, ListBox, Radio or ForeignKey control if the inserted value does not appear in the list of values of the dropdown or bullet list,
- Inserting a value into a File or Image control
- And at the same time, it is a situation where one of the control elements during value picking causes the form to be updated using the javascript function “form_Update” or “bt_Click”. Such an update will not be done because earlier the form will be automatically updated by NET Genium itself.
- The solution to this situation is to call the javascript function “form_DisableUpdate” in the “onchange” event of one of the picked elements, ideally on the first control element that is part of the picker.
1.5.54. External functions
- This report displays a list of external function calls across the entire application.
- In the control table, a pencil icon appears in the first column to change control settings.
- The name of the view page or edit form also serves as a link to open the view page or edit form on a new tab in the web browser.

1.5.55. External functions (Rights defined)
- This report displays a list of external function calls from controls that have rights to at least one user group or users.
- In the control table, a pencil icon appears in the first column to change control settings.
- The name of the view page or edit form also serves as a link to open the view page or edit form on a new tab in the web browser.

1.5.56. External functions (total_worker_time)
1.5.57. External functions (execution_count)
1.5.58. External functions (average_worker_time)
1.5.59. External functions (max_worker_time)
- This report shows external function execution statistics, sorted in descending order
- total_worker_time – total processing time of the external function,
- execution_count – number of executions of external function,
- average_worker_time – average processing time of external function,
- max_worker_time – average processing time of the external function.
- This report is available only if logging to the database is enabled in the NET Genium settings and there is at least one record of the execution of the external function. A detailed description of NET Genium settings is given in the separate NET Genium settings manual.
- The external functions table displays information about the script or control to which the external function is associated, and the first column displays a pencil icon to change the definition of that script or control.
- The name of the view page or edit form also serves as a link to open the view page or edit form on a new tab in the web browser.

- Using the “…” link in the “Logging” column, it is possible to display a detailed report with individual script execution records and data on the new web browser tab.
- the date and time of the start of the external function,
- the user who started the external function a
- external function processing time in milliseconds.

- The number of records is limited to 100 by default. This number can be manually increased or decreased by changing the “maxrows” parameter in the report URL.


1.5.60. Names to be translate
- This report shows a list of all occurrences of sentence combinations that lack a multilingual translation. The displayed list is generated as follows:
- a list of used languages is loaded from the “susers” table,
- the default NET Genium language set in the “Config/DefaultLanguage.txt” file is detected and
- a final list of languages is compiled that does not contain the default language NET Genium.
- Subsequently, according to the compiled list, the translations of sentence combinations are checked at:
- application groups,
- applications,
- categories,
- view pages,
- view page controls,
- edit forms,
- edit form controls,
- virtual columns and database query headers,
- javascript functions “alert” and “confirm”,
- parameters of the “COLORLEGEND” functions,
- parameters of the “TEFUIG”, “TESUIG” and “WRITEMESSAGE” functions,
- exceptions in the script,
- subjects of e-mail messages,
- header and footer of e-mail messages.
- In the table with controls, the pencil icon is displayed in the first column, which is used to change the settings of the control, resp. completion of the missing translation.

1.5.61. Dictionary (Export)
- This report compiles an Excel file with the names of all:
- application groups,
- applications,
- categories,
- view pages,
- view page controls
- edit forms,
- edit form controls,
- conditions (QueryBuilder),
- columns + filters (QueryBuilder),
- headers (QueryBuilder),
- scripts and conditions (script).

1.5.62. Dictionary (Import)
- This tool allows you to re-import an Excel file that was created using a dictionary export, see previous chapter. The import will update the names of all:
- application groups,
- applications,
- categories,
- view pages,
- view page controls
- edit forms,
- edit form controls,
- conditions (QueryBuilder),
- columns + filters (QueryBuilder),
- headers (QueryBuilder),
- scripts and conditions (script).
1.5.63. Rights (Applications)
- This report displays a list of all application groups, applications, edit forms and view pages, including the set rights.
- The name of the application group, application, edit form and view page also serves as a link to open the settings of the object, ideally to change the rights settings.

1.5.64. Rights (Edit forms)
- This report displays a list of all application groups, applications and edit forms, including set rights.
- The name of the application group, application and edit form also serves as a link to open the settings of the object, ideally to change the rights settings.

1.5.65. Rights (View pages)
- This report displays a list of all application groups, applications and view pages, including the set rights.
- The name of the application group, application and view page also serves as a link to open the settings of the object, ideally to change the rights settings.

1.5.66. Rights (Controls)
- This report displays a list of all application groups, applications, edit forms and view pages, including controls and set rights.
- The name of the application group, application, edit form, view page and control also serves as a link to open the settings of the object, ideally to change the rights settings.

1.5.67. Rights (User groups)
- This report displays a list of all user groups and their associated users.

1.5.68. Rights (Rights groups)
- This report displays a list of all permission groups and the user groups and users assigned to them.

1.5.69. Database model (SQL)
- This report shows a list of database commands in the MS SQL Server syntax, which can be used to create a new database with the same structure as the NET Genium database, and the use of which is important exclusively for the visualization of the ER diagram. Only database tables associated with edit forms that are linked to other tables and columns representing primary or foreign keys are included in the list of database commands. A list of these commands is also offered for download in a “sql” file.
- It is not possible to compile an ER diagram from the NET Genium database itself, because NET Genium does not use sessions and registers foreign keys as an ordinary “Integer” field with an index enabled. Another difference compared to the NET Genium database itself are the names of individual tables and columns. In the database model, table names will be compiled from the edit form name and its identifier in parentheses (for example, “Cash Document (ng_pnp)”), and column names by analogy from the control name and its identifier in parentheses (for example, “Order number (ng_idorder)) “). The procedure for creating an ER diagram in MS SQL Server Management Studio is as follows:
1. Open MS SQL Management Studio and log in to the server

2. Create an empty database – click on the field “New Database…”

3. Select “Database Model (SQL)” from the “Other” drop-down list and have SQL statements generated

4. Copy commands (“CTRL + C”)

5. In MS SQL Server Management Studio, right-click on the newly created database and select “New Query”

6. Paste the statements (“CTRL + V”) into the newly opened “SQLQuery.sql” window

7. Press the “Execute” button

8. Right-click on “Database Diagrams” and select “New Database Diagram” from the menu

9. Select the tables you want to include in the new diagram and press the “Add” button

10. Press the “Close” button

11. MS SQL Server Management Studio diagram clearly sorts

1.5.70. Database model (MS Access)
1.5.71. Database model (MS Access 2003)
- This report is used to create a new database in MS Access format with the same structure as the NET Genium database, and its use is important exclusively for the visualization of the ER diagram. The newly created database includes only those database tables associated with edit forms that are linked to other tables and columns representing primary or foreign keys. The created database is offered for download and at the same time all commands that created the new database are displayed.
- It is not possible to compile an ER diagram from the NET Genium database itself, because NET Genium does not use sessions and registers foreign keys as an ordinary “Integer” field with an index enabled. Another difference compared to the NET Genium database itself are the names of individual tables and columns. In the database model, table names will be compiled from the edit form name and its identifier in parentheses (for example, “Cash Document (ng_pnp)”), and column names by analogy from the control name and its identifier in parentheses (for example, “Order number (ng_idcontract)) “).
- MS Access has certain limitations that can lead to database creation errors. These limits are related, for example, to the number of indexes set on the table. The user can identify the errors when the word “ERROR” highlighted in red appears on one of the displayed commands and the cause of the error occurs.

- The item “Database model – (MS Access)” makes sense to use only for smaller databases. If errors occur in the MS Access syntax when generating the database intended for visualizing the ER diagram, it is necessary to proceed to the generation of SQL statements that are intended for MS SQL Server (item “Database model – (SQL)”).
- The procedure for creating an ER diagram in MS Access is as follows:
1. Select “Database model (MS Access)” from the “Other” drop-down list and have the database generated.

2. Download the “accdb” file to your computer

3. Open the downloaded database with the “accdb” extension in MS Access

4. Select the “Database Tools” tab and the “Session” option

5. MS Access displays the ER diagram

1.5.72. Database model – complete (SQL)
- This report shows a list of database commands in the MS SQL Server syntax, which can be used to create a new database with the same structure as the NET Genium database, and the use of which is important exclusively for the visualization of the ER diagram. The list of database commands includes all database tables associated with the edit forms, and all their columns. The procedure for creating an ER diagram in MS SQL Server Management Studio is described in detail in the chapter 1.5.69.
1.5.73. Database model – complete (MS Access)
1.5.74. Database model – complete (MS Access 2003)
- This report is used to create a new database in MS Access format with the same structure as the NET Genium database, and its use is important exclusively for the visualization of the ER diagram. The newly generated database includes all database tables associated with the edit forms, and all their columns. The procedure for creating an ER diagram in MS Access is described in detail in the chapter 1.5.70.
1.5.75. NET Genium database model (SQL)
- This report shows a list of database commands in the MS SQL Server syntax, which can be used to create a new database with the same structure as the NET Genium database, and the use of which is important exclusively for the visualization of the ER diagram. The list of database commands includes all system tables (in NET Genium it is not possible to access these tables via edit forms), and all their columns.
1.5.76. NET Genium database model (MS Access)
1.5.77. NET Genium database model (MS Access 2003)
- This report is used to create a new database in MS Access format with the same structure as the NET Genium database, and its use is important exclusively for the visualization of the ER diagram. The newly generated database includes all system tables (in NET Genium it is not possible to access these tables via edit forms) and all their columns.
1.5.78. Logs
- This report displays a list of all log files with the “log” extension located in the “Logs” directory, with the option to download or delete them.
- A detailed description of the log files is given in the separate Administrators Guide.

1.5.79. DomLib
- This report shows the result of the “DomLib” analysis based on the “Request.UserAgent” value.
- “DomLib” analysis is used to identify the client's web browser.

1.5.80. NGDPH + jsngdph
- This report shows in the left column a list of VAT rates used by the server function “NGDPH” and the javascript function “jsngdph”, and in the right column a list of VAT rates published on the website https://euvatrates.com/rates.json.
- The differences between the rates are shown in red.

1.5.81. Headers
- This report displays the contents of the “Request.Headers”, “Request.Cookies”, “Request.ClientCertificate” and “Response.Headers” collections.


1.5.82. Server variables
- This report shows the contents of the “Request.ServerVariables” collection.

1.5.83. MAC
- This report shows a list of all devices that have an assigned MAC address, as well as MAC addresses stored in the “license.txt” file.
- Use this report to identify license key issues.

1.5.84. Sessions
- This report shows a list of all active sessions.

1.5.85. Connections (netgenium)
- This report shows a list of all active connections to the “netgenium” database with the “kill” option of the given connection.

1.5.86. Connections
- For database server “MSSQL”
- This report shows a list of all active connections to all databases with the option to “kill” the connection.

1.5.87. Running queries (netgenium)
- This report displays a list of all currently processed database queries in the “netgenium” database with the “kill” option of the given query and displays a table with Running scripts.
1.5.88. Running queries
- For database server “MSSQL”
- This report displays a list of all currently processed database queries in all databases with the option to “kill” the given query and displays a table with Running scripts.
1.5.89. FbConnection.ClearPool
- For the “Firebird” database server
- This command updates the cache memory of all Firebird database processes and threads.
- Each time the database structure is changed (adding a new column, renaming a column, changing a column data type, deleting a column), NET Genium will try to synchronize the new database structure in all processes or threads by running the “FbConnection.ClearPool” command. In fact, this means that all currently open connections to the database are closed and the “connection pool” is emptied. If any of these connections are actively in use at the same time, the “FbConnection.ClearPool” command will fail and the error message “Update Firebird metadata cache failed” will be displayed. Please run FbConnection.ClearPool manually.”. This error message does not limit the administrator who initiated the database structure change. Its thread has changed structure, so its thread is already out of sync. Only other users could see error messages such as “Column not found in database” and so on. Usually, you just have to wait a while for other users' threads to sync. If this does not happen for a long time and it is necessary to solve the situation urgently, it is possible to run the “FbConnection.ClearPool” command manually directly from NET Genium tools.